VOO vs IVV vs SPY: comparing three S&P 500 ETFs
Compare VOO, IVV, and SPY using official issuer documents, expense ratios, structure, objective, and practical limitations.
In this comparison



VOO, IVV, and SPY all seek to track the S&P 500, but they are separate funds with different issuers, histories, trading details, and stated costs. This is a document-based comparison, not a ranking or hands-on test. The figures below were checked against official issuer pages on 2026-09-08 and can change.
 The products are shown with equal visual weight; the graphic does not imply a winner.
At a glance
Scroll sideways or use arrow keys to read the full table.
| Fund | Issuer | Objective | Expense ratio checked | Exchange / structure |
|---|---|---|---|---|
| VOO | Vanguard | S&P 500 Index | 0.03% | ETF; check current listing and trading terms |
| IVV | iShares / BlackRock | S&P 500 Index | 0.03% | NYSE Arca ETF |
| SPY | State Street SPDR | S&P 500 Index | 0.0945% gross | Exchange-traded ETF; first U.S.-listed ETF |
The ratios are not the whole cost. Brokerage commissions, bid–ask spreads, taxes, currency conversion, account fees, and the price paid relative to NAV can matter. See expense ratio vs total cost.
What is broadly similar
Each fund is designed to provide large-cap U.S. equity exposure through the S&P 500. That shared objective does not mean identical holdings at every moment: index rebalances, corporate actions, cash, sampling, securities lending, and valuation timing can create small differences.
All three are ETFs, so shares trade during market hours at market prices. A market price can differ from NAV, and the spread depends on liquidity and conditions. Read ETF vs mutual fund for wrapper mechanics.
What to compare before choosing
Objective and benchmark
Confirm the exact S&P 500 benchmark language and return basis in the current prospectus. “Tracks the S&P 500” does not by itself specify whether a displayed return is price return or total return, or how dividends and withholding taxes are treated.
Expense ratio and total cost
The official pages show similar VOO and IVV ratios and a higher stated SPY ratio at the dates above. That is a factual snapshot, not a forecast of tracking or net returns. Compare the fee schedule of your broker, spread, currency, tax treatment, and any recurring investment features.
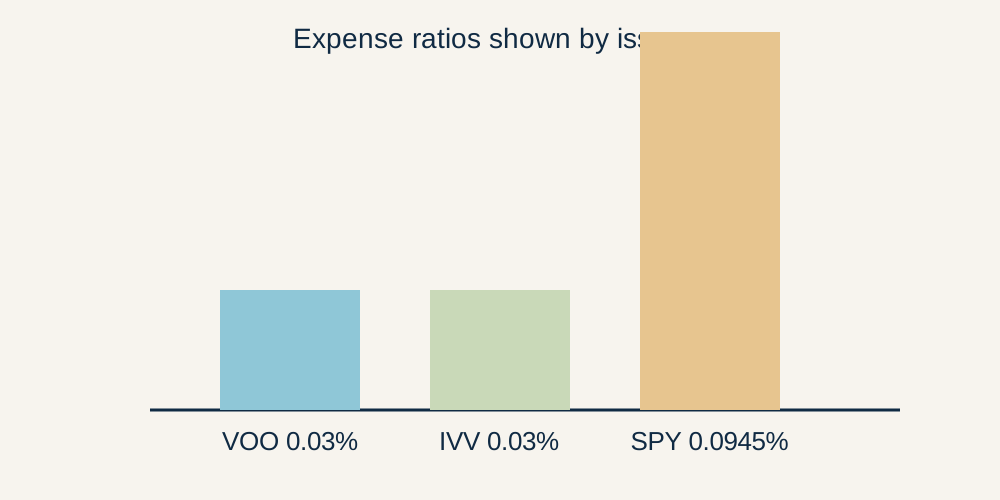 Issuer figures checked on the dates stated in the handoff; not a performance chart.
Trading and access
SPY’s long trading history and market ecosystem may matter to some traders, while a long-term investor may care more about account access, recurring purchases, fractional shares, and total cost. Availability and features depend on the broker and jurisdiction. This article does not test any broker implementation.
Portfolio and implementation
Review holdings, concentration, securities-lending disclosures, sampling, cash, and tracking information in the latest official documents. Shared index exposure can still produce different realized results after costs and implementation.
A neutral decision routine
- Confirm that S&P 500 exposure is actually the goal.
- Compare current prospectuses and fact sheets, not old screenshots.
- Check the ratio date and whether gross or net expenses are shown.
- Add broker, spread, tax, currency, and account costs.
- Check access features and dealing constraints.
- Review overlap with other funds; use fund-overlap guidance.
General education only. No fund is ranked or recommended, and no investment outcome is promised. Investing can result in loss.