Fund overlap: when several funds hold the same investments
Learn how to check fund overlap, look through shared holdings, and avoid mistaking a longer fund list for genuine diversification.
In this guide
Owning more funds does not necessarily mean owning more diversification. Funds can share the same companies, sectors, countries, currencies, or risk factors. Fund overlap is the portion of exposure that appears in more than one holding. The useful test is not the number of fund names; it is what you own after looking through each fund’s current holdings and weights.
Why names can mislead
An “international,” “technology,” or “growth” label describes an objective, not a complete portfolio. Two funds can use different labels while holding many of the same large positions. Conversely, two funds with similar labels can have different benchmarks, sampling methods, or concentration limits.
The SEC’s diversification guidance warns that several funds may overlap, leaving a portfolio more concentrated than the fund count suggests. This is U.S.-oriented education; holdings, disclosure dates, and tax treatment vary by product and jurisdiction.
A simple overlap worksheet
Collect each fund’s latest official holdings file or shareholder report. Record the security identifier, position weight, sector, country, and date. Normalize names where possible—one issuer can appear under different share classes or tickers. Then add the weights across funds.
Example: Fund A has Company X at 6% and Fund B has Company X at 4%. If your account is split 60% A and 40% B, your look-through exposure to X is 0.60 × 6% + 0.40 × 4% = 5.2% of the combined portfolio. This is a hypothetical calculation, not a current holding claim.
The same method works for sectors or countries: multiply each fund weight by your allocation to that fund, then sum the matching exposure. Keep the holdings date visible because portfolios change.
Separate overlap from concentration
Two funds can overlap heavily without making one security a dominant portfolio position, and they can overlap lightly while each is concentrated in a different risk. Measure both questions. First, identify the shared holdings. Second, calculate the combined look-through weight of each issuer, sector, country or factor in your own account.
Suppose Fund A and Fund B share 30% of their holdings by weight, but your account allocates only 10% to each fund. That pair occupies 20% of the account, so the 30% fund-level overlap cannot be read as “30% of my whole portfolio is duplicated.” Your allocation weights still matter. Conversely, a single fund that is 25% of the account and places 20% in one issuer creates a 5% account-level exposure even if no second fund owns that issuer.
There is no universal overlap percentage that makes a portfolio suitable or unsuitable. The decision depends on the goal, time horizon, other assets, liquidity needs and the type of risk being duplicated. Use the calculation to reveal exposure, not to manufacture a pass/fail score.
Four layers to inspect
Security overlap
List the largest shared issuers. A portfolio can appear broad while several funds all hold the same mega-cap companies. Check direct holdings and look-through holdings in fund-of-funds products.
Sector and industry overlap
Different issuers can still respond to the same industry cycle. Add sector weights and note whether a “broad” fund already contains a large technology, financial, or energy allocation.
Geography and currency overlap
Country labels may hide multinational revenue exposure, while currency risk can differ from company domicile. Record the fund’s stated country and currency methodology rather than infer it from a name.
Factor and strategy overlap
Value, growth, momentum, small-cap, quality, and dividend strategies can load on related risks. Two funds may own different securities but react similarly to rates, credit conditions, or market stress.
A comparison table
Scroll sideways or use arrow keys to read the full table.
| Question | What to collect | Why it matters |
|---|---|---|
| What is shared? | Issuer, sector, country, currency | Shows duplicated exposure |
| How much is shared? | Weight in each fund and your allocation | Converts overlap into portfolio exposure |
| When was it measured? | Holdings and report dates | Older data may no longer describe the fund |
| What drives returns? | Benchmark and strategy | Different names can hide similar risks |
| What is missing? | Cash, derivatives, private or thinly disclosed assets | A simple top-holdings check may understate exposure |
What overlap does not prove
Overlap is not automatically bad. A reader may intentionally hold a core fund and a smaller satellite fund that shares some companies. Overlap also does not prove that a portfolio has no diversification: bonds, cash, regions, durations, and currencies can still differ.
Nor does a low overlap percentage guarantee safety. Funds may have different liquidity, leverage, derivatives, credit quality, or implementation risks. The wrapper—ETF or mutual fund—does not settle these questions; see ETF vs mutual fund.
Common mistakes
- Comparing fund names instead of the benchmark and holdings date.
- Adding published fund weights without multiplying by your own allocation.
- Counting an issuer once when several share classes or subsidiaries represent related exposure.
- Treating the top ten holdings as the entire portfolio.
- Assuming “commission-free” or a low expense ratio removes concentration risk.
- Using a third-party overlap calculator without checking its data date and methodology.
A repeatable review routine
Review overlap when adding a fund, when a benchmark reconstitutes, or when your allocation changes. Save the source files and date. Start with the largest positions, then compare sector, geography, currency, and strategy exposures. If a material part of the portfolio is not disclosed clearly, label it unknown rather than estimating precision.
For a broader risk framework, read how risk tolerance differs from risk capacity, then consider whether new money or rebalancing would change the combined exposure. This is an educational process, not individualized portfolio advice.
General education only. Holdings and risks change, and this guide is not personalized investment, tax, or legal advice. Investing can result in loss.
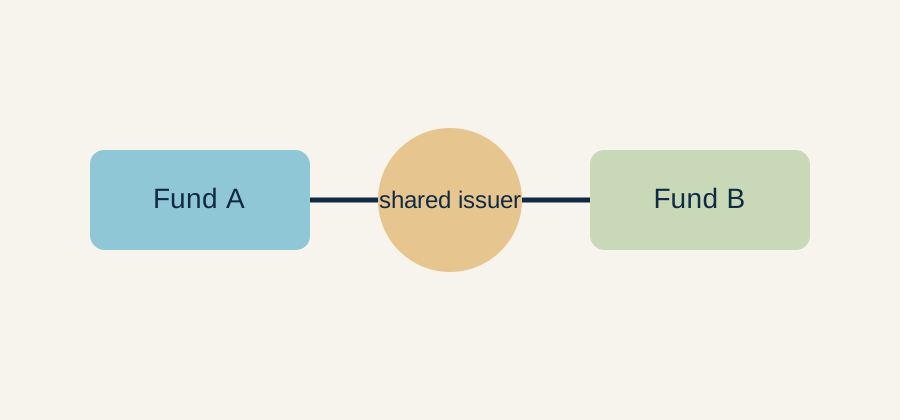 Two fund names can point to the same underlying issuer.
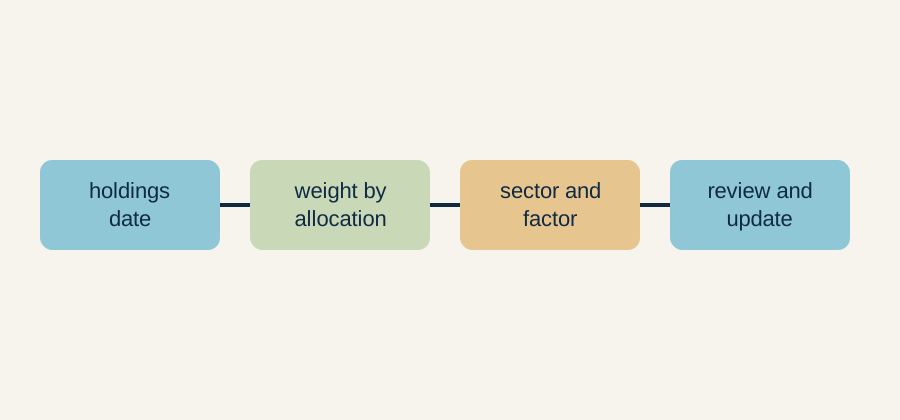 Use holdings dates, portfolio weights, sector review, and periodic updates.