Expense ratio is not total cost: what fund investors still pay
Learn why a fund expense ratio is only one part of total cost, including trading, account, tax, advice, and access costs.
In this guide
The short answer is simple: an expense ratio measures a fund’s annual operating expenses as a percentage of its average net assets. Total cost is broader. It can include trading friction, sales charges, account or platform fees, advice, taxes, currency conversion, and the cost of buying or selling through your chosen route.
That distinction matters because a low headline ratio does not automatically mean the lowest cost for your situation. This guide explains the layers without recommending a particular fund.
What an expense ratio measures
The expense ratio is usually shown as a percentage. A hypothetical fund with a 0.20% ratio spends about $2 per year for every $1,000 invested, before considering the effect of changing balances. The charge is normally taken from fund assets rather than billed as a separate invoice. Your return is therefore reduced by the fund’s expenses, all else equal.
The ratio generally covers recurring operating costs such as management, administration, recordkeeping, distribution, custody, and other fund expenses disclosed in the prospectus. The exact components and presentation depend on the product and disclosure rules. A gross ratio may be reduced temporarily by a fee waiver; check whether a net ratio and waiver expiry are shown.
An expense ratio does not tell you what the fund owns, whether its tracking is close, whether it is liquid, or whether it suits your objective. It is a cost field, not a quality score.
The costs outside the ratio
Trading and dealing costs
Buying or selling can create brokerage commissions, bid–ask spread, exchange fees, or market impact. For an ETF, the spread is the gap between the best displayed buying and selling prices. For a mutual fund, purchase, redemption, exchange, or account charges may apply. These costs can be small for a long holding period and meaningful for frequent transactions.
Sales loads and share classes
Some mutual funds charge a sales load when you buy or sell. “No-load” means no sales load; it does not mean the fund has no expenses. Different share classes can have different distribution charges, minimums, or ongoing ratios. Compare the class actually available in your account.
Account, platform, and advice fees
A broker, workplace plan, adviser, or fund platform can charge account, custody, subscription, or transaction fees. A platform may also restrict which share classes are available. These charges belong in the investor’s total-cost view even when the fund’s own ratio is unchanged.
Taxes and currency conversion
In a taxable account, distributions and realised gains can create tax costs that vary with the fund, transactions, and local rules. Converting money into the fund’s dealing currency can add a spread or fee. Tax-advantaged accounts may change the result, but they do not erase every account or trading cost. Readers outside the United States should not apply U.S. tax assumptions without local guidance.
Opportunity and behaviour costs
A fund that is difficult to trade or automate may lead to missed contributions. A very low ratio can also tempt an investor to trade more often. These are not line items in a prospectus, but they can affect the result of a plan.
A transparent example
Assume two funds each start with $10,000 and are held for one year. Fund A has a 0.20% expense ratio and no other stated costs. Fund B has a 0.10% ratio, but the investor pays a $15 platform charge and $20 of round-trip dealing costs. Ignoring market returns and taxes, Fund A’s operating expense is about $20; Fund B’s ratio is about $10, then the other costs bring its total to about $45.
This is a hypothetical illustration, not a forecast. Actual balances change, fees may be percentage-based or fixed, and some charges may occur only once. The point is the comparison method: add the costs that apply to the route you can actually use.
A practical total-cost checklist
Before comparing funds, collect the current prospectus, shareholder report, account schedule, and trading terms. Ask:
- What is the gross and net expense ratio, and when does any waiver end?
- Are there sales loads, purchase, redemption, exchange, or account fees?
- What spread, commission, exchange fee, or minimum applies to each trade?
- Does the fund distribute gains or income in a taxable account?
- Is currency conversion required, and what rate or markup is used?
- Does the platform charge for custody, advice, data, or recurring purchases?
- Do the fund’s holdings, risks, liquidity, and tracking make the comparison meaningful?
If an answer is missing, mark it as unknown rather than assuming zero.
A simple worksheet
Create one row for each fund and columns for operating ratio, transaction charges, spread or dealing costs, account and platform fees, advice, taxes, currency conversion, and one-off exit costs. Record whether each item is a percentage, a fixed amount, or an estimate, and note the document and date behind it. Multiply percentage costs by the balance or transaction amount they actually affect; do not add a one-time $20 charge to an annual percentage as if both were recurring.
Then test the worksheet against two patterns: a buy-and-hold investor and a regular contributor. The first may be more sensitive to the ongoing ratio and custody fee. The second may see recurring minimums, spreads, or conversion charges. This is a comparison tool, not a prediction of a future return.
Why the cheapest ratio is not always the best choice
Costs matter, but they are not the only decision. Two funds with similar names can hold different securities, use different sampling methods, or carry different concentration and liquidity risks. A fund with a slightly higher ratio may be easier to access, automate, or trade at a fair price in your account. That does not make it automatically better; it means the total comparison needs context.
Start with the exposure and objective, then inspect the full cost of the available access route. Compare wrapper mechanics in ETF vs mutual fund, then use the stock-ownership guide’s cost checklist as a broader reminder of purchase, holding, and selling costs.
How small percentages compound
Suppose a hypothetical account stays at $10,000 before costs for ten years. A 0.20% annual operating expense would be roughly $20 in the first year, but the opportunity cost continues as fees leave less money invested. The exact effect depends on returns, deposits, withdrawals, and when the charge is taken. A simple percentage comparison is useful for scale, not a promise of savings.
Fixed charges can dominate small balances. A $25 annual account fee equals 0.25% of $10,000 but 2.5% of $1,000. Conversely, a spread paid once may matter less than an ongoing ratio for a long holding period, while repeated purchases can make the spread and commissions recur. This is why “total cost” is a calculation tied to a holding pattern, not a universal ranking.
ETF and mutual-fund details to verify
An ETF normally trades on an exchange during market hours. The displayed market price can be above or below the fund’s net asset value, and the bid–ask spread changes with liquidity and market conditions. A mutual-fund order generally receives the next calculated NAV, subject to the fund’s dealing cut-off and charges. Neither mechanism makes the underlying portfolio safer.
Check whether your broker supports fractional ETF shares, recurring purchases, dividend reinvestment, and the specific exchange. For a mutual fund, check minimums, share class, transaction windows, and whether the platform adds a fee. These access terms can change the practical cost even when the fund documents show the same ratio.
Questions readers often ask
Is the expense ratio taken from my bank account?
Usually it is accrued and deducted from the fund’s assets, so the quoted return is reported after operating expenses. You may not see a separate debit. Other costs, such as a brokerage commission or platform charge, can appear directly on your account statement.
Does a zero-commission trade mean zero cost?
No. A zero commission promotion may still leave a bid–ask spread, exchange or currency fee, fund expenses, taxes, or an account charge. Read the broker’s current schedule and the fund’s current documents.
Should I always choose the fund with the lowest ratio?
No. First establish that the funds have comparable objectives, holdings, risks, and access. Then compare the costs that actually apply to your account and behaviour. A lower ratio is relevant evidence, not a complete decision rule.
Can I calculate total cost exactly in advance?
Not always. You can estimate known percentages and fixed charges, but future trading, taxes, spreads, distributions, and account activity are uncertain. Label assumptions, use a range when appropriate, and update the estimate when terms change.
Where should I look for the answer?
Start with the prospectus fee table and shareholder report. Then read your broker, platform, workplace-plan, or adviser schedule. Keep the date you checked each document. If the documents conflict, pause the comparison and seek clarification from the provider or a qualified local professional.
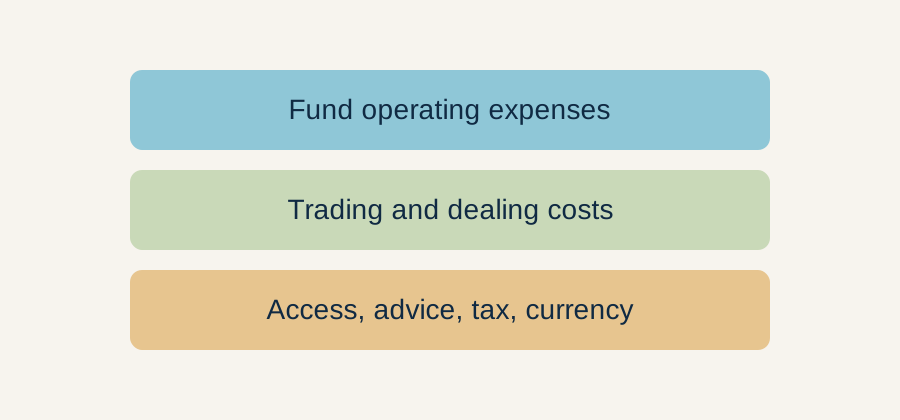 The expense ratio is only one layer; trading and access costs may sit outside it.
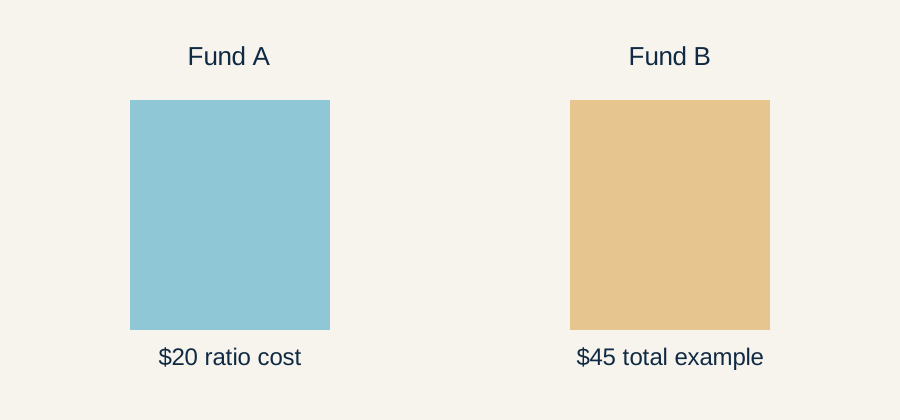 Illustrative example only: fixed and trading costs can outweigh a small ratio difference.