P/E ratio explained: denominator choices and comparison limits
Learn what the P/E ratio measures, how trailing and forward earnings differ, and why accounting, growth, peers and negative earnings can make comparisons misleading.
In this guide
The price-to-earnings ratio, or P/E, is a compact comparison: share price divided by earnings per share (EPS). It tells you how much the market price represents for one unit of reported earnings. The catch is the denominator. “Earnings” may mean the last 12 months, an estimate for the next year, or an adjusted figure. A P/E without its earnings period, accounting basis, share-count basis and comparison group is incomplete.
Investor.gov describes P/E as one way to compare a stock’s price with its past or with other companies. FINRA likewise treats it as a commonly quoted valuation measure, not a stand-alone conclusion. This guide uses U.S. market terminology and fictional numbers only; it includes no live quote or recommendation.
The basic formula
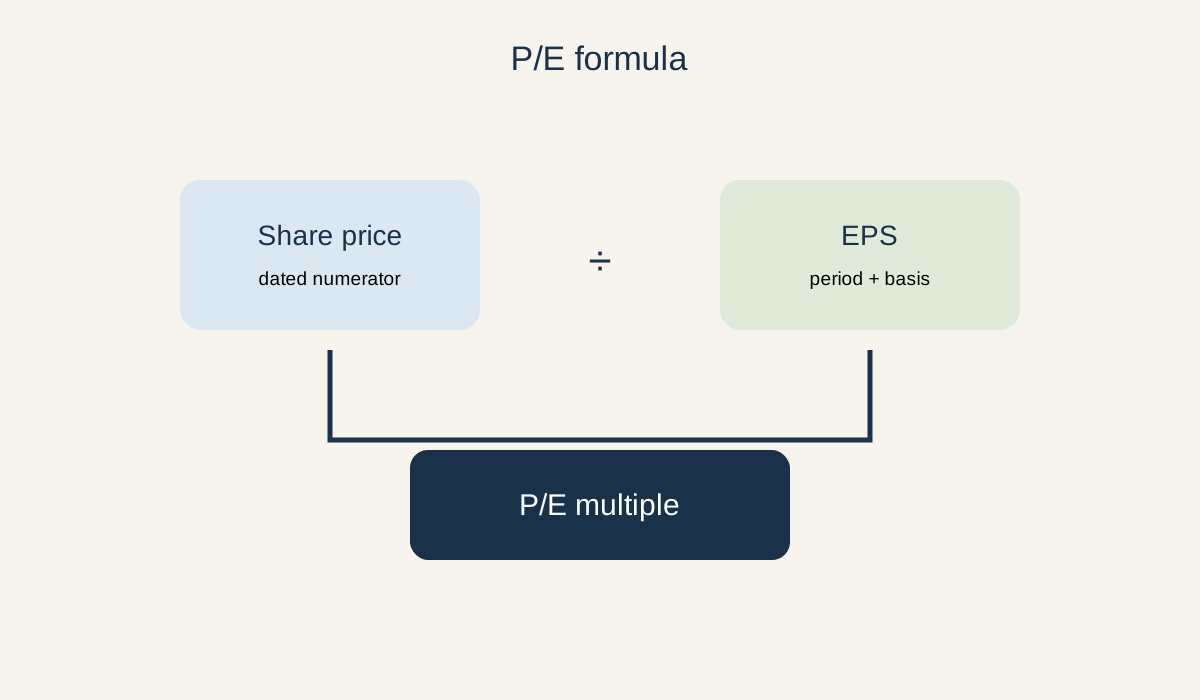 Visual: the numerator is price; the denominator is a defined EPS measure.
P/E = current share price ÷ earnings per share
If a fictional share trades at $60 and EPS is $3, the P/E is 20. That does not mean the company will earn $3 every year, that the price is fair, or that an investor will recover the purchase price in 20 years. It is a snapshot based on the chosen price and earnings measure.
EPS itself is a ratio: earnings attributable to common shareholders divided by a share count. Basic and diluted EPS can differ because options, convertibles or other instruments may increase the potential share count. A quote service may also use continuing operations, total net income or an adjusted “underlying” number. Record the exact definition before comparing.
The denominator can move without a price change
P/E can rise or fall even when the share price is unchanged. If a company reports lower earnings, the denominator shrinks and the multiple rises. If it issues shares, diluted EPS may fall even when total profit is flat. An acquisition can add earnings, but integration costs or a larger share count may change the ratio in the other direction. These mechanical effects are prompts to read the filing, not automatic good or bad news.
When you see a large year-on-year change, separate three questions: did the market price change, did reported earnings change, and did the share count or accounting basis change? A data screen often combines those answers into one number. Rebuilding the calculation from the filing makes the source of the movement visible.
Trailing, forward and normalized P/E
Trailing P/E
Trailing P/E uses earnings already reported, commonly the most recent 12 months (often called LTM or TTM). Its advantage is that the numerator and denominator are historical and can be checked against filings. Its limitation is that the past year may include a recession, a windfall, a restructuring charge or a business mix that no longer exists.
Forward P/E
Forward P/E uses expected future earnings, often the next four quarters or next fiscal year. The estimate may come from analysts or company guidance. It can be useful when a business is emerging from a temporary shock, but the denominator is an assumption, not a reported fact. Always record the estimate date, source, fiscal period and whether it is a consensus or a single forecast.
Normalized or adjusted P/E
Some analysts replace reported earnings with a normalized or adjusted figure intended to remove unusual items. That can make a recurring business easier to compare, but the judgment is consequential. A “one-time” cost can recur; stock compensation, acquisition costs, impairment and restructuring may be economically important even when excluded. Read the reconciliation and ask who selected the adjustments.
Why a high or low P/E is not a verdict
A high P/E can reflect expectations of faster growth, stronger margins, lower perceived risk or more durable competitive advantages. It can also reflect temporarily depressed earnings. A low P/E can signal a bargain, but it can also reflect a shrinking business, leverage, cyclicality, legal risk or earnings that are unusually high today. The multiple alone cannot distinguish those stories.
P/E also ignores the company’s financing mix. Two businesses with identical operating performance can show different net earnings because one carries more debt and interest expense. For some comparisons, investors examine enterprise-value multiples or cash-flow measures as additional lenses. Those measures have their own definitions and limitations; adding a metric does not remove uncertainty.
Industry cycles create another trap. A producer near the top of a commodity cycle may report unusually high earnings and a very low P/E just before profits fall. The same producer near the bottom may show a very high P/E—or no meaningful P/E—because earnings are temporarily depressed. Comparing a multi-year range, normalized margins and balance-sheet resilience can provide context, but it still does not produce a guaranteed fair value.
Five comparison checks
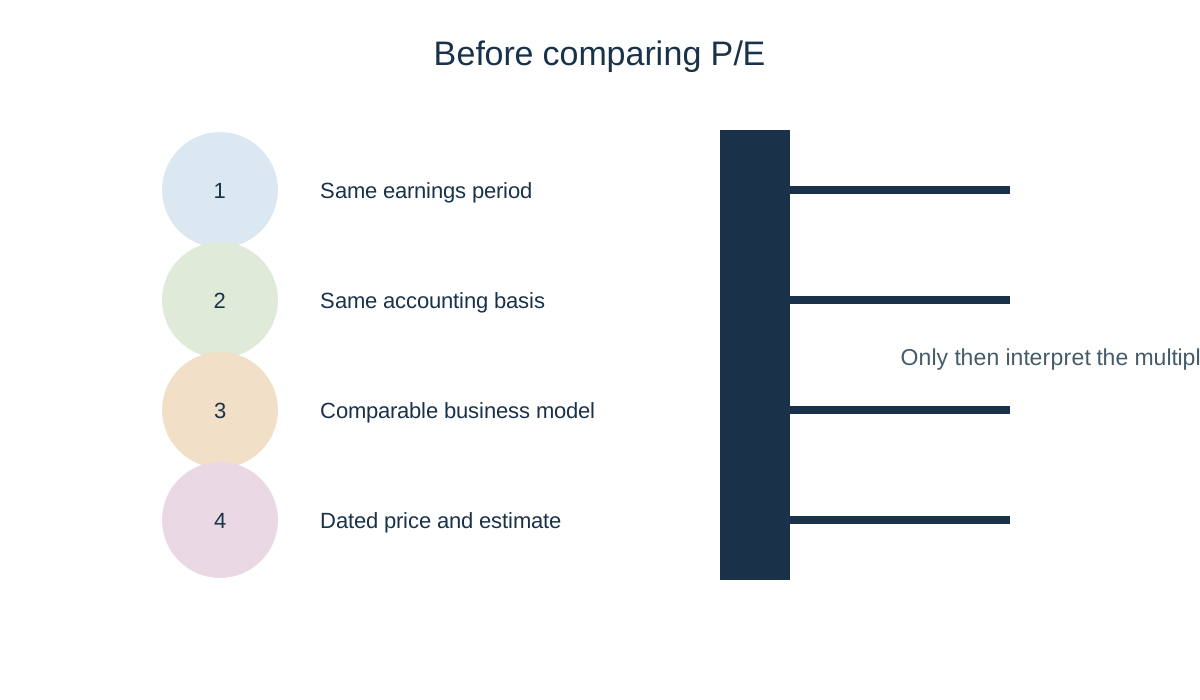 Visual: comparison checks that keep a P/E reading from becoming a score.
1. Same earnings period.
Compare trailing with trailing or forward with forward. A trailing P/E for one company against a next-year estimate for another is not an apples-to-apples comparison. Fiscal years can end in different months, and a recent acquisition may appear in only part of one company’s period.
2. Same accounting basis.
Check GAAP versus adjusted earnings, continuing versus total operations, and basic versus diluted EPS. An adjustment that raises EPS lowers P/E mechanically; that does not mean the business became cheaper. If the share count changed materially, note the reason.
3. Comparable business models.
P/E is usually more informative among companies with similar economics, accounting and growth profiles. A mature utility, a cyclical manufacturer and a loss-making software start-up answer different questions. Compare segments, margins, reinvestment needs and balance-sheet risk before treating a peer multiple as a benchmark.
4. Similar growth and risk assumptions.
Price reflects expectations, not only current earnings. A company expected to grow faster may trade at a higher multiple. But expected growth is uncertain, and paying for it creates disappointment risk. Ask what growth, margin and reinvestment assumptions would have to be true for the current multiple to make sense.
5. Dated price and earnings data.
P/E changes whenever the price moves or a new earnings period is added. Save the “as of” date for both. A historical multiple copied into a current article can be stale even if the formula is correct. For a company you are researching, start with its primary filings, then verify newer disclosures.
What happens when earnings are zero or negative?
If EPS is zero, division by zero makes P/E undefined. If EPS is negative, the result is negative mathematically, but many data services display “N/M” (not meaningful) because a negative multiple does not carry the usual interpretation of price paid for positive earnings. Do not compare a profitable company’s P/E with a loss-making company’s negative or blank value as if they were points on one scale.
For an unprofitable company, you may need other questions: revenue quality, gross margin, cash burn, debt maturities, dilution and a credible path to profitability. Alternative ratios such as price-to-sales or enterprise value to a cash-flow measure can add context, but none is a substitute for understanding the business.
A transparent fictional example
Imagine Company A and Company B both trade at $50. Company A reports diluted EPS of $2 from the last 12 months, so its trailing P/E is 25. Company B reports $1 because a one-time impairment reduced earnings; its trailing P/E is 50. That does not establish that A is cheaper. Read the impairment note, check cash flow and ask whether B’s future earnings are expected to recover.
Now suppose an analyst estimates B will earn $2 next year. Its forward P/E would be 25, but the estimate can be wrong. If the estimate assumes a margin recovery that never arrives, the apparent discount disappears. The example shows why the denominator and its assumptions matter more than a single headline multiple.
A practical P/E worksheet
For each company, record:
- price and timestamp;
- EPS amount, period and whether it is basic or diluted;
- GAAP, adjusted or normalized basis;
- trailing, forward or other label;
- estimate source and date, if forward;
- share-count changes, acquisitions and unusual items;
- peer set and why those peers are comparable;
- what the multiple does not capture: debt, cash, cyclicality, dilution, regulation or execution risk.
Then write one sentence that begins, “This comparison is informative only if…” The sentence forces you to expose the assumptions instead of presenting P/E as a score.
What P/E cannot tell you
P/E does not forecast a share price, guarantee growth, measure management quality, reveal liquidity, or prove that a stock is overvalued or undervalued. It does not capture every claim on the business, and reported earnings can be affected by accounting estimates, one-time items and capital structure. A low multiple can remain low; a high multiple can rise or fall.
Use P/E as one dated lens alongside the business description, risks, cash flows, balance sheet and security details. Use how to read a 10-K for the primary-filing workflow, and read what owning a stock means for the broader question of what a share represents. This is general education, not personal investment, tax or legal advice. Recheck the latest filings, price, EPS definition and estimate source before relying on any current comparison.