Coupon rate, current yield, and yield to maturity explained
Learn the difference between coupon rate, current yield, and yield to maturity, with a transparent bond example and the limits of each measure.
In this guide
The short answer is simple: coupon rate uses par value, current yield uses the bond’s current market price, and yield to maturity (YTM) uses the purchase price plus the bond’s promised cash flows under a set of assumptions. They can all describe the same bond, but they answer different questions.
That distinction matters because a bond can keep paying the same coupon while its market price and yields change. TreasuryDirect explains the relationship directly for Treasury notes and bonds: when YTM is above the stated interest rate, the price is below par; when YTM is below the stated rate, the price is above par. The price-yield relationship is generally inverse, but a yield measure is not a complete description of risk or a guarantee of what you will realize.
The three measures at a glance
Scroll sideways or use arrow keys to read the full table.
| Measure | Main formula or idea | What it answers | What it leaves out |
|---|---|---|---|
| Coupon rate | Annual coupon payment ÷ par value | What contractual interest rate is attached to the bond? | Current price, capital gain or loss, fees, taxes, and default risk |
| Current yield | Annual coupon payment ÷ current market price | What is the coupon income relative to today’s price? | Time value of money, maturity value, reinvestment, and many costs |
| Yield to maturity | A rate that equates price with all scheduled cash flows through maturity | What annualized return would the purchase imply if assumptions hold? | A sale before maturity, changed cash flows, default, taxes, and reinvestment uncertainty |
The formulas are deliberately simplified. Actual securities can have accrued interest, irregular cash flows, calls, sinking funds, floating rates, inflation adjustments, or different compounding and day-count conventions. Read the instrument’s offering document and the provider’s yield convention before comparing numbers.
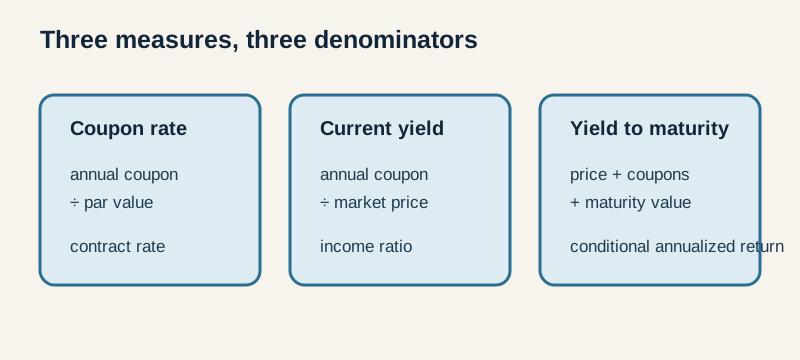 The three measures use different bases: par value, market price, and the full scheduled cash-flow stream.
1. Coupon rate: the contractual percentage of par
The coupon rate is the annual interest promised on a bond, expressed as a percentage of its par or face value. If a bond has a $1,000 par value and a 6% coupon, its scheduled annual coupon is $60, usually split into two $30 payments for a conventional U.S. bond. The payment is tied to par, not automatically to the price you pay in the market.
That makes coupon rate useful for understanding the bond’s contract. It is not, by itself, the return a new buyer will earn. If the bond later trades for $900, the coupon can remain $60 while the buyer’s income relative to the purchase price is higher. If it trades for $1,100, the same $60 is a smaller percentage of the buyer’s outlay.
Coupon rate also does not tell you whether the issuer will pay. Credit quality, liquidity, inflation, call provisions, and the legal terms of the security remain separate questions. A higher coupon is not automatically a better bond; it may reflect greater risk or a bond issued when market yields were higher.
2. Current yield: coupon income divided by today’s price
Current yield is a quick income ratio:
Current yield = annual coupon payment ÷ current market price
Investor.gov gives the same basic definition and example: a bond paying $80 per year at a $1,000 market price has an 8% current yield. Using the hypothetical 6% coupon bond above:
- At a $1,000 price, current yield is $60 ÷ $1,000 = 6.00%.
- At a $900 price, it is $60 ÷ $900 = 6.67%.
- At a $1,100 price, it is $60 ÷ $1,100 = 5.45%.
The coupon did not change. The denominator did.
Current yield is helpful when you want a fast comparison of stated coupon income relative to a quoted price. But it ignores the difference between the purchase price and the amount repaid at maturity. Buying a $900 bond that will repay $1,000 creates a potential price gain; buying it for $1,100 creates a potential loss. Current yield does not include that effect, and it does not discount future payments for time value.
Be careful with “price.” A quoted clean price may exclude accrued interest, while the cash amount paid at settlement can include it. Ask whether a platform’s displayed yield uses clean price, dirty price, settlement date, and a particular day-count convention.
3. Yield to maturity: a whole-cash-flow calculation
YTM is designed to incorporate the bond’s price, coupon payments, time to maturity, and repayment of par. Conceptually, it is the discount rate that makes the present value of the scheduled cash flows equal to the bond’s price. FINRA lists YTM alongside coupon yield, current yield, yield to call, and yield to worst because “yield” is not one universal number.
For a plain, noncallable bond, YTM is often the most informative single annualized measure when comparing a purchase at a known price. But the phrase “if assumptions hold” matters. A quoted YTM generally assumes you hold to maturity, receive every scheduled payment, and reinvest interim coupons at the implied rate. It is not a promise that your realized return will equal the quote.
A transparent example
Suppose a hypothetical bond has:
- $1,000 par value;
- a 6% annual coupon, or $60 per year;
- five years remaining to maturity; and
- a market price of $900, before any accrued interest.
Its coupon rate is 6.00%. Its current yield is 6.67%. Its YTM would be higher than 6.67% because the calculation also recognizes the possible $100 difference between the $900 purchase price and $1,000 repayment, spread across five years and discounted using the timing of all cash flows. The exact YTM depends on payment frequency and convention; this article is explaining the logic, not publishing a quote.
If the same bond traded at $1,100, its current yield would fall to 5.45%, and its YTM would be lower still because the buyer would be paying a premium that is scheduled to amortize toward $1,000 at maturity.
Do not infer a precise YTM by averaging the coupon and the price difference. Use a calculator that states its convention, or verify the provider’s calculation against the offering documents.
What a one-year holding period changes
Suppose you buy the $900 bond and sell it after one year instead of holding it for five years. You may receive one year of coupon income, but the sale price will depend on market yields, credit conditions, liquidity, accrued interest, and the buyer’s required return at that time. The $100 difference between purchase price and par is not automatically yours after one year. It is part of the maturity cash flow that YTM spreads across the assumed holding period. This is why a quoted YTM should not be copied into a personal return forecast for a shorter holding period.
Why the numbers move in opposite directions
Imagine that market yields for comparable bonds rise after the 6% bond is issued. New buyers can now seek more income elsewhere, so the older bond’s fixed $60 stream becomes less attractive. Its price may fall until its overall yield is competitive. If comparable yields fall, the older stream can look more attractive and its price may rise.
The coupon is fixed by the bond’s terms. Current yield changes because the price changes. YTM changes because the price, cash-flow timing, or both change. TreasuryDirect’s pricing table summarizes the usual relationship for Treasury notes and bonds:
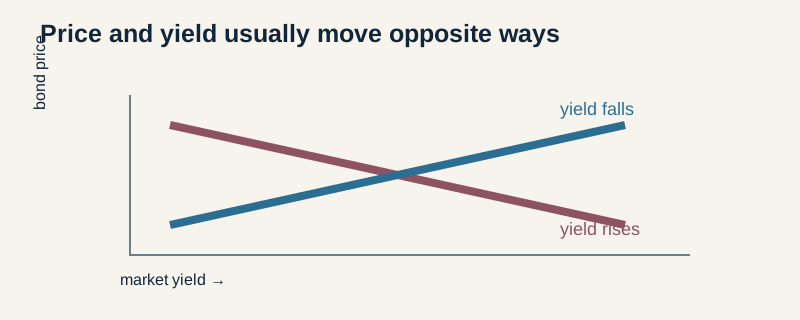 Illustration of the usual inverse relationship; it is not a live quote.
Scroll sideways or use arrow keys to read the full table.
| If YTM is… | The price is generally… |
|---|---|
| Greater than the stated interest rate | Below par |
| Equal to the stated interest rate | At par |
| Less than the stated interest rate | Above par |
This is a general relationship, not a promise that every security moves by the same amount. Credit spreads, liquidity, options, inflation expectations, and the shape of the yield curve can move alongside benchmark rates.
YTM is not yield to call, yield to worst, or a total-return forecast
Callable bonds may be redeemed before maturity. In that case, a yield-to-call calculation can be more relevant than YTM, and a provider may show yield to worst—the lowest of several specified scenarios. A bond fund can show portfolio yield measures while continuously buying and selling holdings, so its experience is not identical to holding one bond to a fixed maturity.
YTM also does not include every possible investor outcome. A default can interrupt cash flows. A sale before maturity creates a market price that may be above or below the purchase price. Taxes, transaction costs, bid-ask spreads, and reinvestment rates can reduce the realized result. Floating-rate and inflation-linked securities require their own conventions.
For these reasons, treat YTM as a conditional comparison measure, not a guarantee. The bond duration guide explains a different question: how sensitive a bond’s price may be to a change in relevant yield.
A practical checklist before comparing yields
- Identify the instrument. Is it a fixed-rate bond, bill, floating-rate note, TIPS, callable bond, or fund?
- Confirm the price basis. Is the quote clean or dirty, and does it include accrued interest?
- Name the yield convention. Annual or semiannual compounding, day-count basis, settlement date, and provider method can matter.
- Check the cash-flow assumptions. Does the calculation assume maturity, call, prepayment, or inflation adjustment?
- Separate income from price movement. Current yield is not a total-return estimate.
- Read the risks. Credit, liquidity, inflation, currency, tax, and reinvestment risks can remain even when a yield looks attractive.
- Use current documents. Terms, prospectus, auction results, and the provider’s current holdings or quote govern the actual security.
The idea to keep
Use the measures in sequence:
- Coupon rate: what the bond promises on par.
- Current yield: what that coupon represents relative to today’s price.
- YTM: what the full scheduled cash-flow stream implies under stated assumptions.
The comparison is useful, but the numbers are not interchangeable and none is a complete risk score. Continue through the Bonds & Rates learning path for price sensitivity, credit risk, and other fixed-income concepts.