Sequence-of-returns risk: why the order of returns matters in retirement
Learn why the order of investment returns can affect retirement withdrawals, with a transparent example and limits—not a promised safe rate.
In this guide
Sequence-of-returns risk is the risk that the order in which investment returns occur changes how long a portfolio can support withdrawals. Two portfolios can have the same average return over a period but very different outcomes when one experiences losses early, while the owner is taking money out. Early losses shrink the base that can participate in a later recovery.
That is a description of a mechanism, not a prediction that a particular market will fall or a claim that one allocation is suitable for you. The effect depends on starting assets, withdrawals, timing, inflation, fees, taxes, other income, investment mix, and the length of retirement.
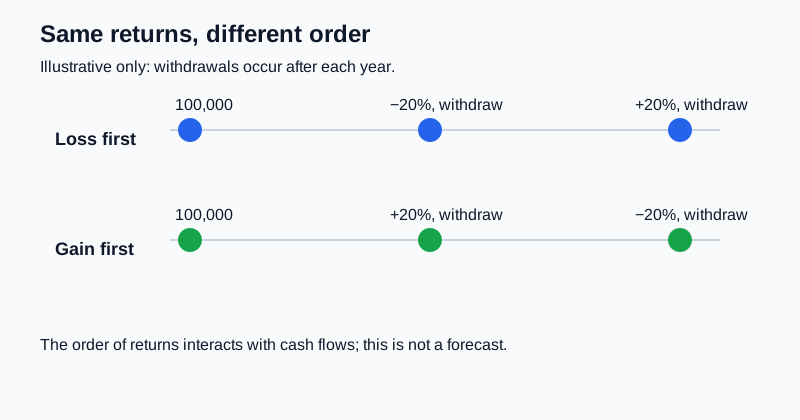
Visual: the order of returns matters when withdrawals occur; values are illustrative, not a forecast.
The short answer: withdrawals make timing matter
If you are still contributing, a fall in prices can leave new contributions buying more units. During retirement, the direction of cash flow is reversed: you are selling or withdrawing units to pay expenses. A loss followed by a withdrawal leaves fewer units and less capital available when prices recover.
FINRA warns that people approaching or entering retirement may have less time to recover from a market downturn and should reassess both investment risk and yearly withdrawals. Vanguard similarly describes keeping near-term spending in a cash-like account as one way to avoid selling investments every time a bill arrives. These are educational observations, not a universal portfolio recipe.
Average return is not the same as return path
The arithmetic average of two annual returns can hide the experience between them. Consider this deliberately simplified illustration:
Scroll sideways or use arrow keys to read the full table.
| Assumption | Path A | Path B |
|---|---|---|
| Starting portfolio | 100,000 | 100,000 |
| Year 1 return | −20% | +20% |
| Year 2 return | +20% | −20% |
| Return sequence average | 0% | 0% |
| Withdrawal at end of each year | 5,000 | 5,000 |
The average of +20% and −20% is 0% in both paths, but compounding is multiplicative: 100,000 × 0.8 × 1.2 equals 96,000 before withdrawals, not 100,000. With withdrawals, Path A has roughly 75,200 after the second withdrawal, while Path B has roughly 75,800 under the same simplified timing. The exact difference is not the lesson; the lesson is that the path and cash-flow dates matter.
This example is not a historical return series, a Monte Carlo result, or a safe-withdrawal calculation. It ignores taxes, fees, inflation, changing spending, deposits, dividends, and the fact that real returns do not arrive as neat two-year pairs.
Why an early loss can be harder to recover from
Suppose a portfolio falls 30%. It then needs a gain of about 42.9% to return to its starting value, because the gain is measured from the smaller balance. If the owner also withdraws money after the fall, the required recovery is larger still.
The sequence problem is therefore strongest when three things overlap:
- withdrawals begin or continue;
- a large loss arrives early in the withdrawal period; and
- the portfolio needs growth later to fund many more years.
A person with other reliable income and flexible spending may withdraw less from investments during a downturn. Someone with a fixed bill and no other cash flow may have less flexibility. The same market return can therefore have different consequences for different household cash flows.
What can change the size of the risk?
Withdrawal size and timing
Taking a fixed amount, an inflation-adjusted amount, or a percentage of the current balance produces different paths. Monthly versus annual withdrawals also change the timing of sales. Do not compare a result until the withdrawal rule is written down.
Portfolio mix and diversification
Asset allocation affects both expected volatility and the pattern of gains and losses. Diversification can reduce concentration in one security or sector, but it cannot remove market-wide losses. A more conservative mix can also have lower expected growth. The relevant question is not “which mix wins?” but whether the assumptions, cash needs, and tolerance for loss are coherent.
Other income and a cash-flow buffer
Wages, a pension, public benefits, rental income, or a cash reserve may reduce the amount that must be sold after a decline. Availability and rules differ by country. A cash-like holding can itself lose purchasing power to inflation and is not automatically risk-free.
Spending flexibility
Reducing discretionary spending, delaying a planned purchase, or earning temporary income may lower withdrawals in a bad sequence. That is a planning option, not a promise that every reader can or should make the same adjustment.
Fees, taxes, and inflation
Costs reduce the balance available for future returns. Inflation can raise the amount a withdrawal must cover. Tax treatment can differ by account, withdrawal type, and jurisdiction. A scenario that omits these inputs may be useful for learning the mechanism but should not be presented as a personal retirement forecast.
A practical way to test a plan
Write the inputs before choosing a conclusion:
- starting balance and account types;
- withdrawal amount, frequency, and whether it rises with inflation;
- expected other income and its start date;
- return paths, including at least one unfavorable early path;
- fees, taxes, inflation measure, and currency;
- time horizon and any staged goals; and
- rules for changing spending or withdrawals.
Then compare at least two return orders using the same average assumptions. Change one input at a time. Record the first year in which the balance becomes too low for the stated spending plan, but do not label that year a guaranteed failure date. It is an output of the assumptions.
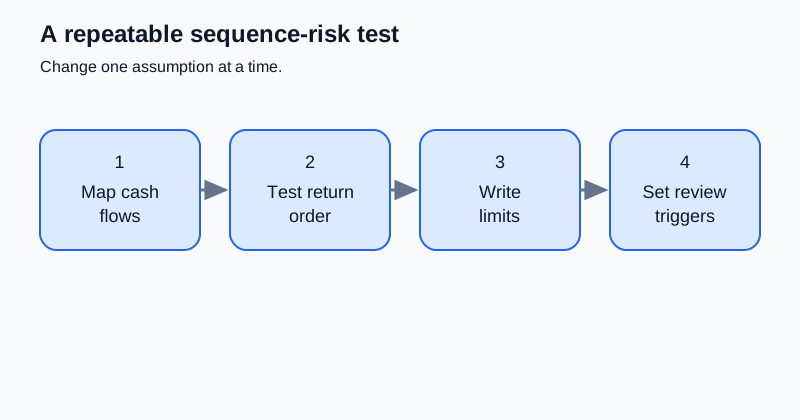
Visual: a repeatable review workflow for testing sequence risk.
The zcompound long-term goal worksheet can help you make assumptions explicit. The rebalancing guide explains a related portfolio-maintenance decision. None of these pages selects an investment or determines a safe withdrawal rate.
A small model is useful only when its labels are honest
You do not need a complicated simulator to see the mechanism. A spreadsheet with one row per month can track an opening balance, a return assumption, a contribution or withdrawal, and an ending balance. The important design choice is to preserve the order of the rows instead of replacing every year with one long-run average.
For example, create a baseline with a constant illustrative return, then duplicate it twice: once with weaker returns in the first five years and once with the same weaker years later. Keep the starting balance, total withdrawals, fees, and inflation treatment identical. The comparison isolates sequence rather than quietly changing several assumptions at once.
Label every output as “under these assumptions.” If a chart shows a balance reaching zero, explain whether zero means the model can no longer fund the stated withdrawal, not that a real person must experience that exact date. If the model uses annual returns, say that monthly market movements and withdrawal timing are simplified. Reproducibility is more valuable than false precision.
Also separate nominal and real values. A withdrawal that stays numerically flat may buy less over time if prices rise. An inflation-linked withdrawal may preserve purchasing power but increase the amount leaving the account after a poor early sequence. Neither rule is automatically right; each answers a different planning question.
What this concept cannot tell you
Sequence-of-returns risk does not tell you when to retire, how much to withdraw, which funds to buy, or whether a cash reserve or annuity is suitable. It does not establish a universal “safe” percentage. Research results depend on the return history, fees, inflation, taxes, spending rule, horizon, and failure definition used.
The rules for pensions, public benefits, retirement accounts, withdrawals, tax, and investor protection are jurisdiction-specific and can change. Check current official sources where you live. For a high-stakes retirement or tax decision, consider a qualified professional whose credentials, scope, and fees you can verify.
A one-page sequence-risk checklist
Goal and horizon: What spending must the portfolio support, and for how long? Starting assets: Which accounts and balances are included? Cash flows: What other income arrives, and when? Withdrawal rule: Fixed amount, inflation-linked amount, or percentage? Return paths: What happens if losses arrive in the first five years? Costs: Which fees, taxes, and inflation assumptions are included? Flexibility: What spending or timing changes are actually available? Review trigger: What event makes you rerun the model?
The useful conclusion is modest: return averages alone are not enough when money is leaving a portfolio. Make the cash flows visible, test more than one order of returns, and keep the scenario's limits beside the result.
Continue with the Retirement & Long-Term Goals learning path, or browse the wider learning-path directory.